Shopping Cart

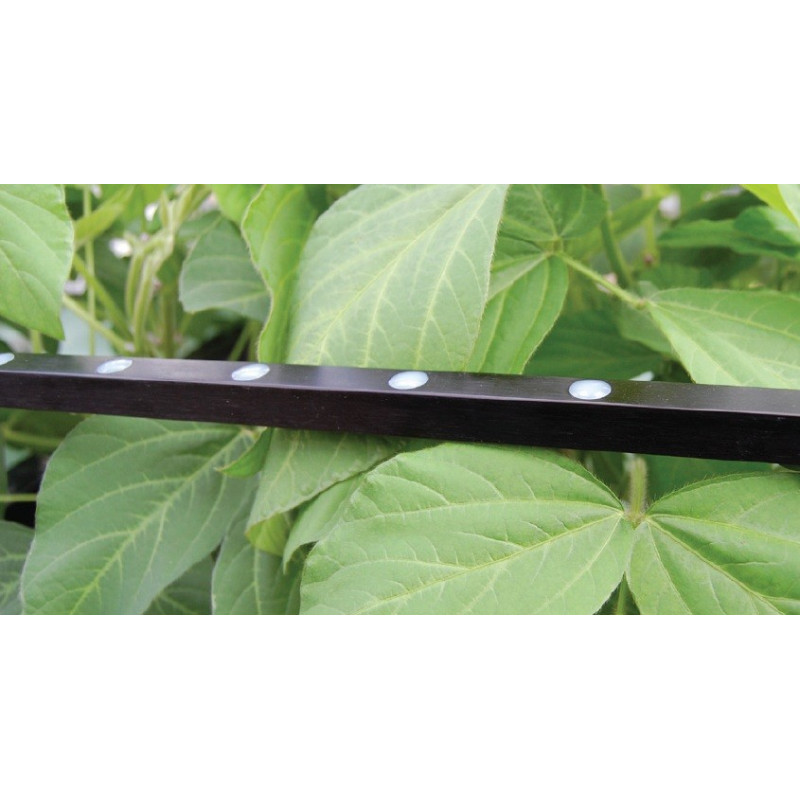


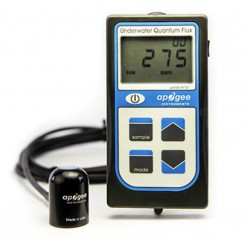
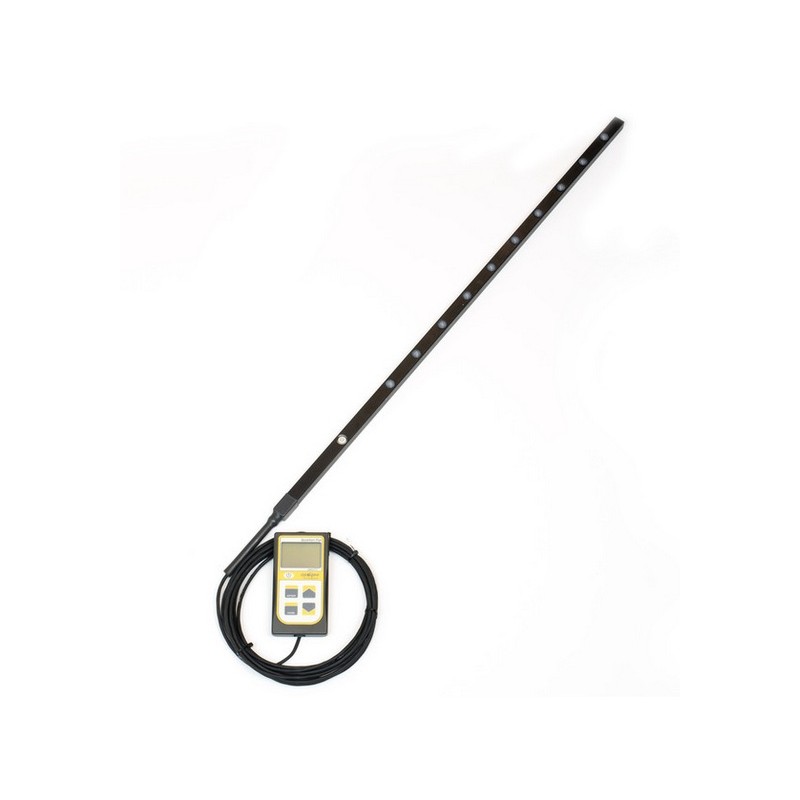
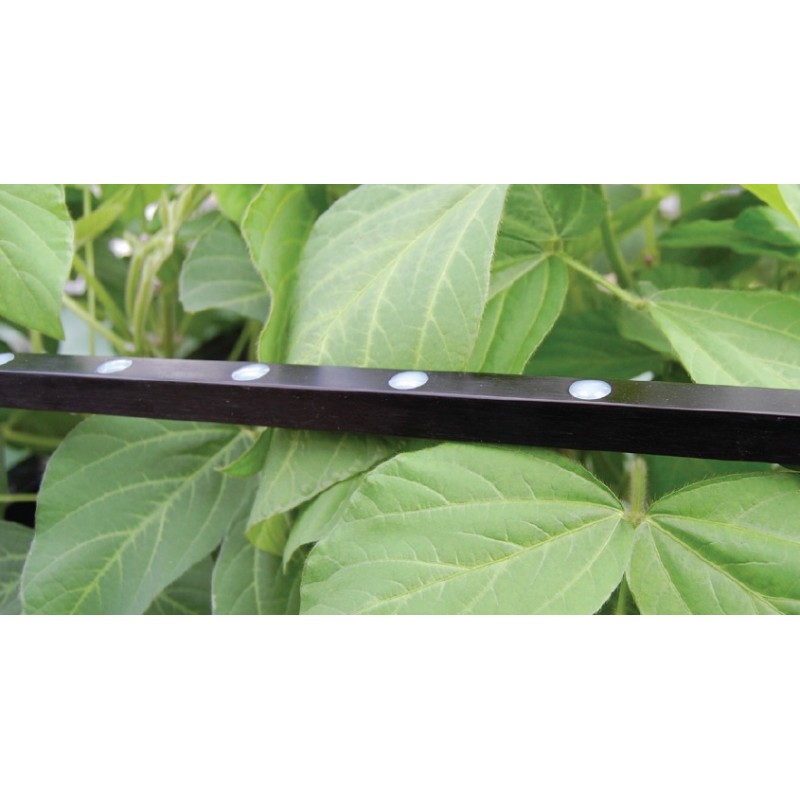
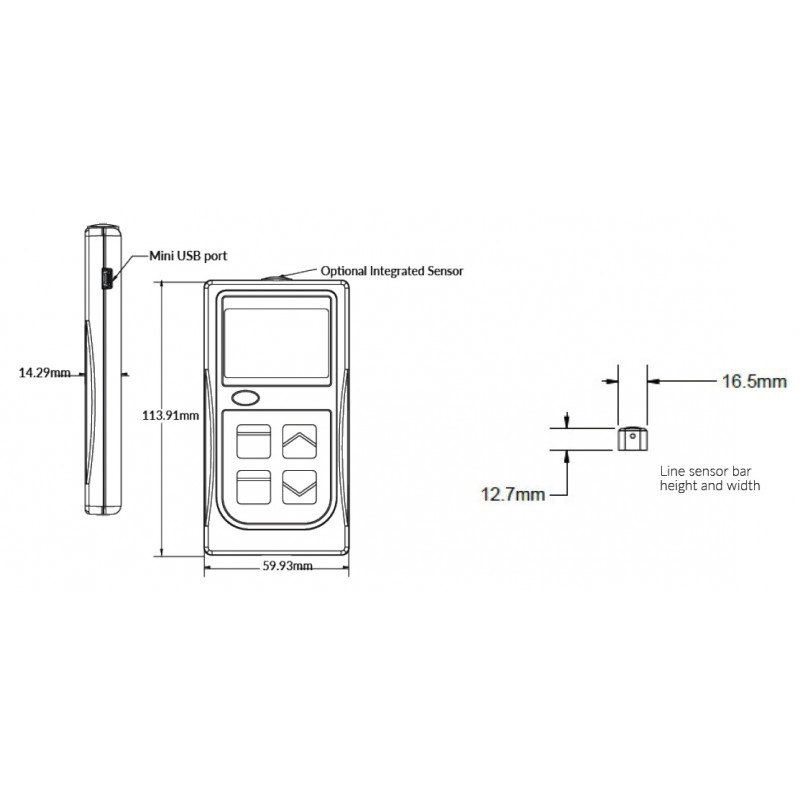
◆ The MQ-301X is composed of a separated sensor bar with 10 sensors connected to a hand-held meter via a 2m cable.
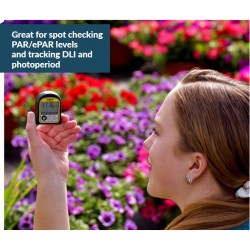
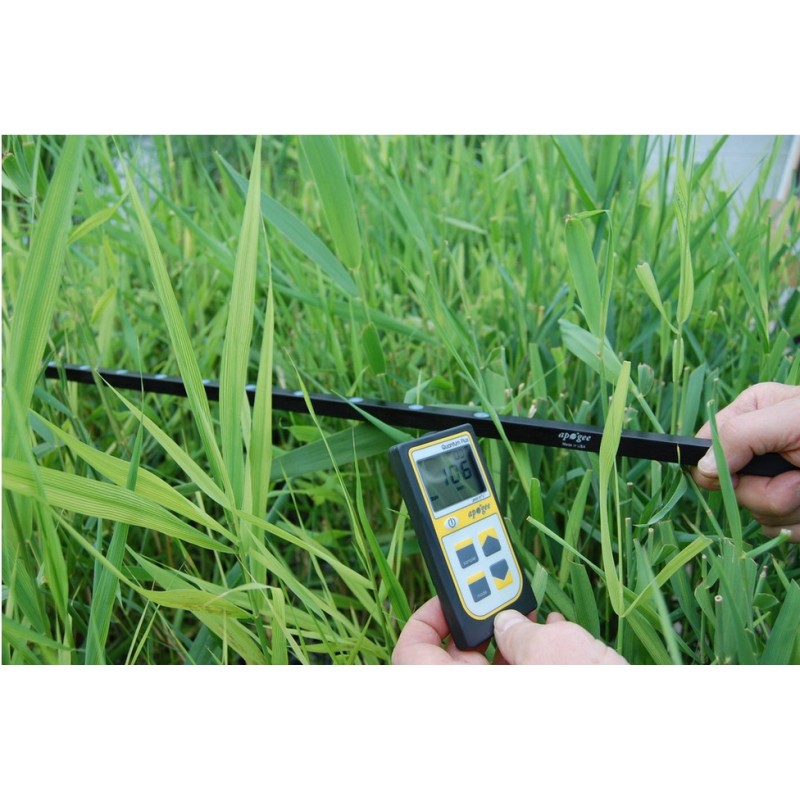
◆ Apogee line quantum sensors measure the spatial average of photosynthetically active radiation (PAR).
The sensor housing design features an integrated bubble level and is fully potted making the sensor weatherproof.
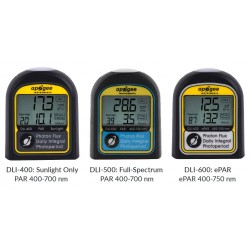
The meter has a sample and log mode, and will record an integrated daily total in mol m-2 d-1. Sample mode will record up to 99 manual measurements. Log mode will power the meter on/off to make a measurement every 30 seconds.
Every 30 minutes the meter will average the sixty 30 second measurements and record the averaged value to memory. The meter can store up to 99 averages, once full it will start to overwrite the oldest measurement with new ones.
An integrated daily total will be recorded from the 48 averaged measurements (making a 24 hr period). Sample and log measurements can be reviewed on the LCD display or by downloading the data to a computer, however, the integrated daily total can only be viewed by downloading the data to a computer.
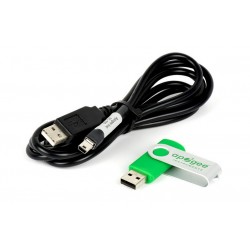
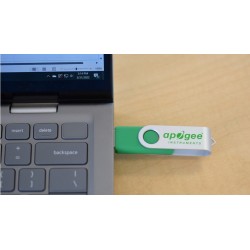
Downloading data to a computer requires the AC-100 communication cable (a standard USB cable will not work) and ApogeeAMS software.
.jpg)
You might also like


