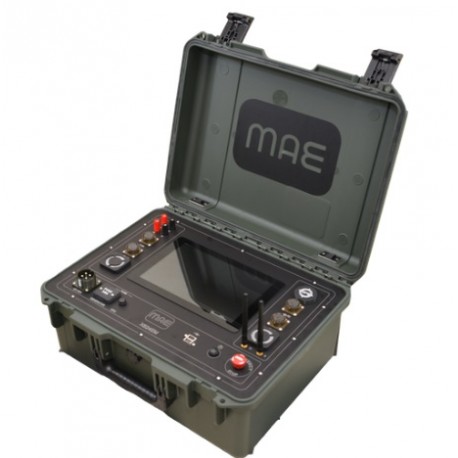
MAE X624EM VHR Multichannel Georesistivimeter 48-72-96 Channels
The X624EM is a standalone instrument that combines multi-channel data acquisition, a high-power current generator, an integrated management computer, and an intuitive ETNET software with a built-in sequencer.
◆ Allows VES and tomography surveys.
All-in-One Solution:
◆ Supports 1D / 2D / 3D / 4D measurements
◆ 10" Touchscreen Display & Integrated GPS
◆ Advanced ETNET Software
◆ Up to 94 Simultaneous Measurement Channels
◆ 24-bit ADC Converter
◆ Integrated 600-Watt Generator
◆ Delivers Up to 800V Power
◆ Real-Time 2D/3D Pseudosection Display
◆ Onboard 2D/3D Sequencer
◆ Built-in Wi-Fi for Remote Control
◆ Cloud-Based Data Management
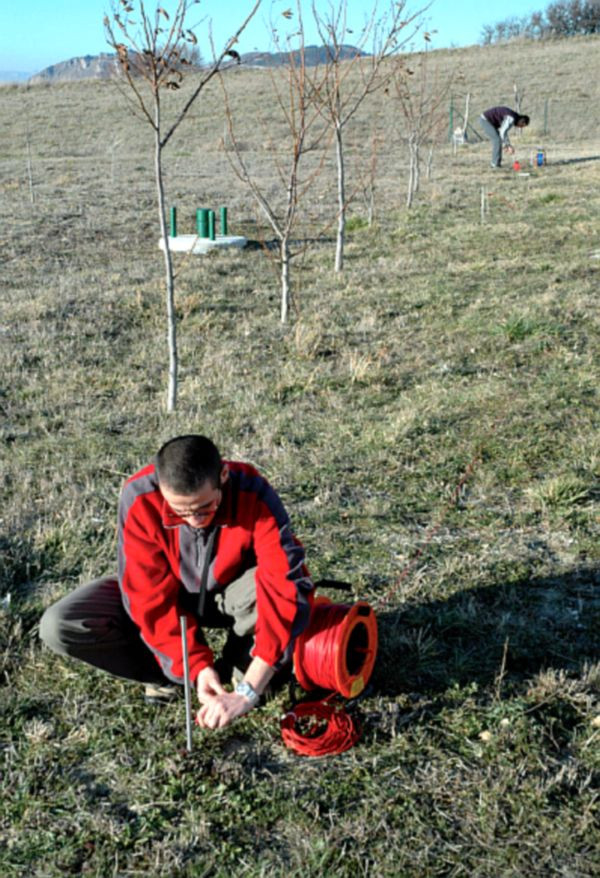
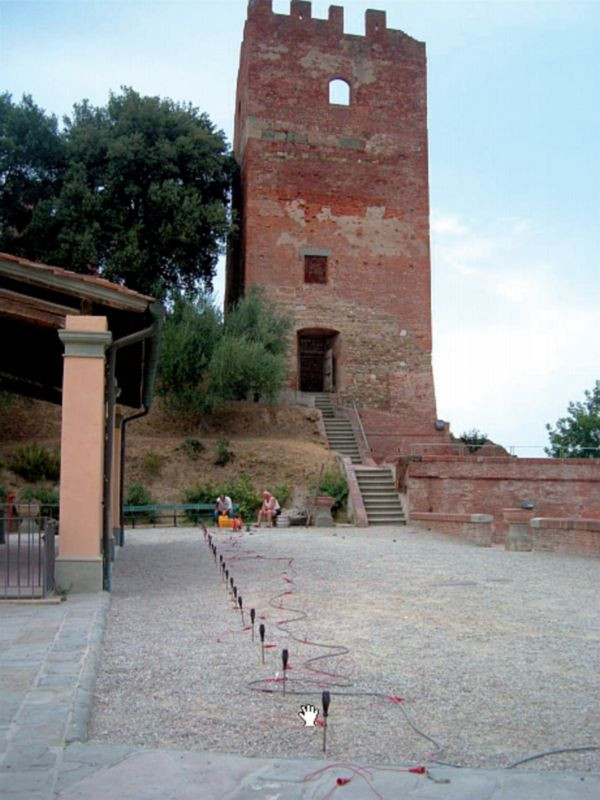
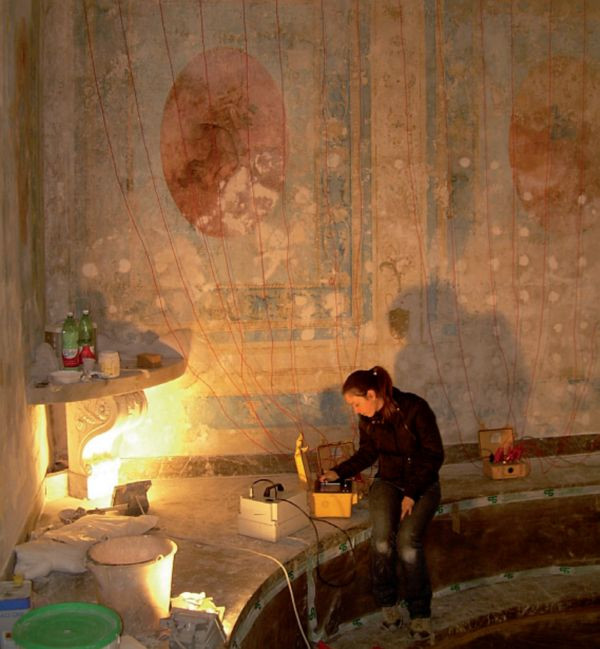
◆ Its exceptional versatility makes it the perfect solution for resistivity and induced polarization surveys, with a wide range of applications such as groundwater exploration, mineral prospecting, geological mapping, geotechnical investigations, and archaeological research. The capability for parallel measurements, combined with an all-in-one design featuring an onboard CPU and the integration of advanced algorithms with powerful hardware, allows the X624EM to deliver precise measurements in record time.
This instrument stands out for its remarkable versatility and the ability to execute 2D and 3D surveys at high speed, thanks to its innovative data acquisition platform. The X624EM offers real-time pseudosection visualization, enabling operators to instantly verify the recorded data. It can automatically perform single measurements or user-defined measurement cycles. Data can be recorded on internal Disk on Module memory, external USB storage, or saved directly to the cloud. The system is managed through the new ETNET software, which includes a host of new features.
Modern 2D and 3D geoelectrical tomography techniques require twice as many measurements as traditional methods.
Unlike previous instruments, which typically feature only a few dozen measurement channels, the X624EM can simultaneously measure potential between any two connected electrodes (excluding the pair used for current input). In a typical configuration with N electrodes, the instrument provides N-2 acquisition channels. For example, with 48 electrodes and 46 independent channels, you can perform up to 1,035 measurements simultaneously with just one current input!
◆ Advantages of the X624EM Architecture:
Multichannel Parallel Strategy:
The X624EM's multi-channel strategy marks a significant breakthrough in electrical data acquisition, especially for 3D configurations. This advanced approach dramatically increases measurement speed, allowing you to obtain accurate and detailed results quickly, reducing hours of fieldwork and lowering operating costs. The multi-channel strategy enhances sequence design efficiency, automatically handling tasks like identifying quadrupoles or key lines, which previously required manual input. Parallel measurements generate vast amounts of data without extending acquisition times, providing more information without compromising speed.
◆ Sequencer:
The management software offers extensive options for designing measurement sequences, including electrode configuration, spacing, and 3D geometry, with a preview of the designed sequence. The Sequencer provides several key benefits that streamline the geoelectric measurement design process:
Field Versatility: Our innovative sequence design allows for quick, on-the-spot configurations without external devices, simplifying the setup process and adapting sequences to your specific survey needs.
Real-Time Visualization: The software provides instant previews of the sequence configuration and estimated investigation depth, optimizing sequence design for the best results.
Efficiency: Onboard sequence design saves time, eliminating the need to return to the lab for complex configurations. Preview sequences, make adjustments on-site, and start measurements promptly.
◆ Methodology:
The ETNET suite offers various measurement methodologies, allowing you to fully customize your geoelectrical data acquisition process:
◆ Flexibility: Choose from different methodologies, including spontaneous potentials, resistivity, and induced polarization, tailoring your survey to the terrain and objectives for the most relevant data.
Customization: Control every measurement parameter, from iterations to current and voltage settings, to optimize your survey for different soil conditions.
Accuracy and Control: The ability to select and customize methodologies gives you precise control over your geoelectric survey, improving data quality and enabling more informed decisions.
◆ Windows Induced Polarization:
The software supports advanced features for induced polarization, allowing you to define time windows with sample intervals starting at 10ms. Key points include:
Custom Measurement Windows: Choose windows from 10ms to capture subtle details in terrain responses, adapting the process according to survey objectives.
Wide Range of Options: Depending on the instrument, select up to 20 measurement windows (with the ET300) or unlimited windows (with the X624EM), offering extensive flexibility.
Full IP Functionality: Obtain a complete discharge curve for induced polarization, capturing every detail over time for more precise analysis.
◆ 2D Pseudosection:
The software provides live visualization modes for acquired data, allowing customization and display of 2D pseudosections for resistivity and induced polarization. Features include:
Real-Time Visualization: Instantly view acquired data, providing immediate insights into terrain characteristics.
Detailed Information: Simultaneous display of resistivity and chargeability offers a comprehensive view of soil properties, aiding in identifying geological structures or anomalies.
Customization: Adjust visualization parameters, such as chart types and color scales, to highlight specific data ranges for detailed analysis.
◆ 3D Pseudosection:
The 3D pseudosection feature allows intuitive insertion of electrode geometry, enabling three-dimensional visualization of acquired data:
3D Visualization: Explore the subsurface with an immersive 3D representation, enhancing the analysis of geological structures.
Geometry Customization: Input electrode geometry and view 3D measurement points in real-time, facilitating immediate feedback on data acquisition.
Parameter Selection: Customize display parameters to fit specific needs, ensuring clear and detailed data representation.
◆ Quality Control:
MAE tools provide complete remote control, maximizing operational efficiency and saving time:
Tablet/Smartphone Control: Manage instruments directly from your smartphone or tablet, adjusting settings, starting captures, or monitoring status from anywhere.
Remote Monitoring: Track survey progress from home or office, design surveys remotely, and initiate acquisitions without leaving your workspace.
Cloud Data Management: Easily archive and retrieve data via the MAE cloud service, ensuring secure access to your data from anywhere.
With the X624EM, geoelectric surveys reach new levels of efficiency, accuracy, and control, ensuring the success of your projects with cutting-edge technology.
General:
ADC technology: 24bit Delta-Sigma ADC
Number of electrodes: 48-72-96 (up to 96 channels)
Array configuration: 1D, 2D, 3D e time-lapse
Measurements: Self potential, Resistivity, Induced Polarization
Dimensions: 49x39x23 cm
Weight: 18kg
Display: 10" touch screen
GPS: Yes
Export compatibility: RESinv, ERTlab, ZondRES, MAE
Roll-along function: Software controlled
Real-time pseudosection: 1D, 2D and 3D
Sequence generator: 1D, 2D and 3D
Case: IP67
Enviromental condition: -20°C / 90°C
Power supply: External 12V battery, suggested 100Ah
Output:
Power output: 600W
Voltage output: ±50V, ±100V, ±200V, ±400V, ±800V
Output current: up to 12A at 50V, up to 0.750A at 800V
Energization diagram: Custom from 250ms
Precision: ±0.2 μA
Accuracy: < 0.2 %
Input:
Measurements strategy: Parallel
Input voltage: ±25V
Precision: 1.5 μV vs fullscale
Accuracy: < 0.2 %
Input impedance: 2.5MΩ
Stacking and noise reduction: Up to 255
Input notch filter: 50Hz
Self potential adjustment: Automatic
IP's windows: 100Hz sampling
Multi-electrode Geoelectrical Prospecting+
V.E.S. Vertical Electrical Survey+
Induced Polarization Measurement+
Spontaneous Potential Measurement+
- Type of Instrument
- Georesistivimeter


.jpg)


